Eurostat: Living conditions statistics at regional level
By global standards, most people living in the European Union (EU) are relatively prosperous. According to the OECD, the subjective well-being of the EU’s population — as measured by life satisfaction — is also relatively high. This likely reflects the EU’s high income/wealth levels and its network of established social protection systems that provide a safety net for the less fortunate.
Nevertheless, the COVID-19 pandemic has underlined systemic inequalities both between and within individual EU Member States. While some people were fortunate enough to continue working full-time from home (and in some cases were even able to save more of their income than usual), frontline and key workers faced increased health risks. Many people in precarious employment or working in sectors/businesses impacted by successive lockdowns faced reduced earnings, short-time work (furlough schemes/temporary lay-off/technical unemployment) and unemployment. Indeed, the asymmetric impact of the pandemic meant that it has in many cases exacerbated existing inequalities: some groups in society have been much more harshly affected than others, for example, the elderly, young people, parents of young children (particularly single-parents), low-wage earners, women, migrants, or people with disabilities.
On 4 March 2021 the European Commission set out its ambition for a stronger social EU to focus on education, skills and jobs, paving the way for a fair, inclusive and resilient socioeconomic recovery from the COVID-19 pandemic, while fighting discrimination, tackling poverty and alleviating the risk of exclusion for vulnerable groups. The European Pillar of Social Rights Action Plan (COM(2021) 102 final) outlines a set of specific actions and headline targets for employment, skills and social protection in the EU. It includes a benchmark for reducing the number of people at risk of poverty and social exclusion by at least 15 million persons (of which, at least five million should be children) between 2019 and 2030.
Sociodemographic characteristics like age, educational attainment, sex or country of birth/citizenship can play an important role in shaping an individual’s living conditions. Wider societal developments, such as the impact of globalisation, coupled with unexpected shocks — for example, the global financial and economic crisis or the COVID-19 pandemic — can also have a considerable impact, in some cases rapidly undoing long-term gradual reductions in inequality, thereby reinforcing or exacerbating patterns of inequality and exclusion.
Access to healthcare and risk of infection
Although the latest regional information on living conditions concerns data for 2019, these statistics may be used to gauge, for example, the resilience of health and social care systems to pandemics such as COVID-19. Data on poverty, income and living conditions can also be used to identify cohorts within the population that are particularly susceptible to the risks associated with shocks.
There are a variety of reasons why an individual may report having unmet needs for medical examination. Such unmet needs may result in poorer health for people not receiving care and may increase health inequalities if concentrated among disadvantaged people. The following are of interest with regard to illustrating equity in access to health care services:
- cost, whereby medical examinations are considered too expensive;
- distance, if patients consider a clinic/hospital to be too far away for an examination or there are no means of transportation available;
- time, when patients are dissuaded from having a particular type of examination because of a lengthy waiting list.
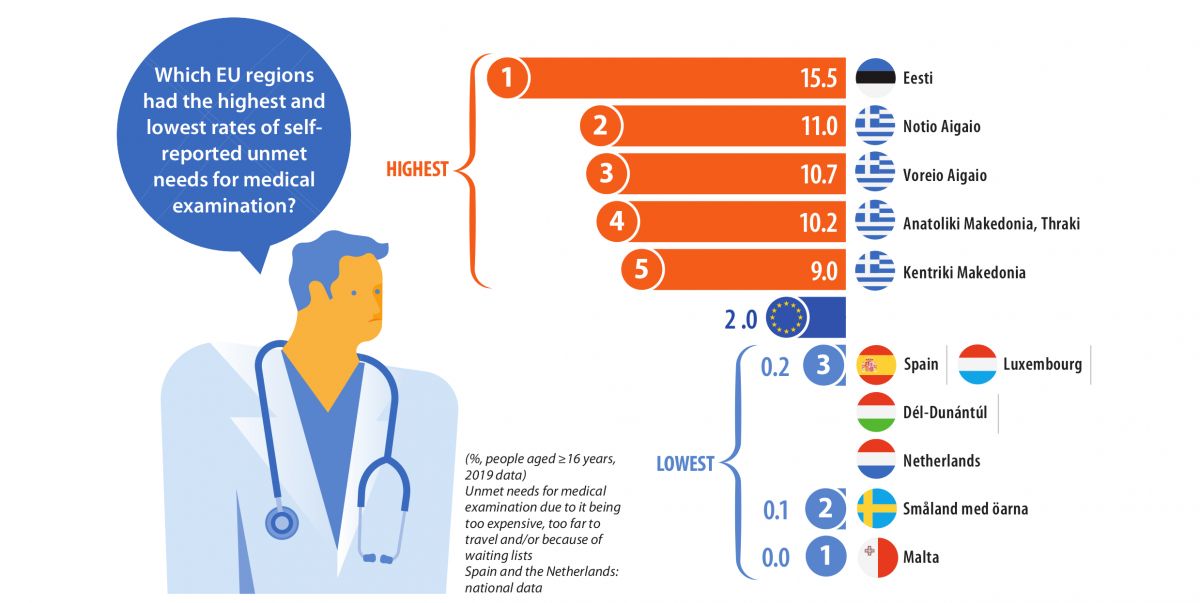
Almost 1 in 60 adults living in the EU had unmet needs for medical examination
In 2019, the proportion of the EU adult population (defined here as people aged 16 years or over) with unmet needs for medical examination — due to it being too expensive, too far to travel, and/or because of waiting lists — was 1.7 %. A closer analysis by sex reveals that the share of women with unmet needs for medical examination (2.0 %) was somewhat higher than the share recorded among men (1.4 %), resulting in a gender gap of 0.6 percentage points. A similar gap — with a higher share for women — was observed across most of the EU Member States, with Bulgaria, the Netherlands and Luxembourg the only ones to report a higher share of their male (rather than female) population facing unmet medical needs; identical shares were recorded for men and women in Spain, Malta and Austria.
Regional shares of the adult population with unmet needs for medical examination were somewhat skewed around the EU average. In 2019, there were 37 regions that had shares below the EU average of 1.7 % (as shown by the blue shades in Map 1), while there were 56 regions with shares that were equal to or greater than the EU average (as shown by the orange shades in Map 1). Note that the statistics presented in this section for Belgium, Italy and Poland relate to NUTS level 1 regions and that only national data are available for Czechia, Germany, Spain, France, the Netherlands, Austria and Portugal. At the upper end of the distribution the share of the adult population with unmet needs for medical examination was particularly high in Estonia and in a majority of regions across Greece (as shown by the darkest shade of orange). Estonia had the highest proportion of unmet needs for medical examination (15.5 %), while three Greek regions — Notio Aigaio, Voreio Aigaio, and Anatoliki Makedonia, Thraki — were the only others within the EU to record double-digit shares. The high proportion of adults in Estonia with unmet needs for medical examination could be attributed largely to the length of waiting lists, while cost was the principal reason for unmet needs for medical examination across Greek regions.
Housing conditions
People in the EU lived in dwellings with an average of 1.6 rooms per person
The COVID-19 pandemic has brought into stark contrast differences in living conditions, for example between people fortunate enough to have a garden and those living in high-rise flats with no balcony. Within the context of the pandemic, the average number of rooms per person may be used, among other indicators, to help assess conditions such as the strain of coping with long periods of confinement at home (alone) or the risks of infection through household transmission.
In 2019, dwellings in the EU had, on average, 1.6 rooms per person. Map 2 shows that there were considerable differences across NUTS level 2 regions; note that the statistics presented in this section for Belgium, the Netherlands and Poland relate to NUTS level 1 regions and that only national data are available for Germany, France and Portugal. The range was from an average of 1.0 rooms per person in four different regions of Romania up to 2.3 rooms per person in Région Wallonne (Belgium). The average number of rooms per person was relatively high in Belgium, Ireland and most of northern and central Spain (outside of their capital regions). Malta and several regions in the Netherlands and in Finland also recorded a relatively high average number of rooms per person.
The distribution of the average number of rooms per person in each region reflects, among other factors, the stock of different types of dwelling and whether or not people are living alone, in nuclear families (a couple and their dependent children) or in extended families. In 2019, more than half (53.3 %) of the EU population lived in a house (detached, semi-detached or terraced), while 46.1 % lived in flats (apartments); a small number of people lived in other forms of dwelling, for example student halls of residence, mobile/recreational homes, or non-residential buildings (such as shopkeepers living above their shop).
The regions with a relatively high average number of rooms per person were often characterised as predominantly rural, where there was often a tendency for people to live in houses (some of which were under-occupied, as grown-up children had already left the family home). By contrast, the age structure of the population is often quite young in predominantly urban regions, where it is often necessary to pay a premium for space. As such, it is perhaps unsurprising to find that a higher proportion of people in predominantly urban regions lived in flats and had a lower average number of rooms available to them. Finally, note that some rural regions of eastern and southern EU Member States are characterised by a relatively high proportion of people living in extended households (for example, with three generations living under the same roof). In these regions it was often commonplace to find a lower average number of rooms per person, as dwellings were more likely to be characterised by a lack of personal space.
People at risk of poverty or social exclusion
There are two principal measures of poverty. Relative poverty concerns the situation where people whose income and/or resources prevent them from enjoying a ‘normal’ standard of living for the society in which they live (in other words, a situation where household income is a certain percentage below the median level). By contrast, absolute poverty is the deprivation of basic human needs, for example, a lack of food, shelter, water, sanitation facilities, health or education (in other words, where a household’s income is insufficient to afford the basic necessities of life).
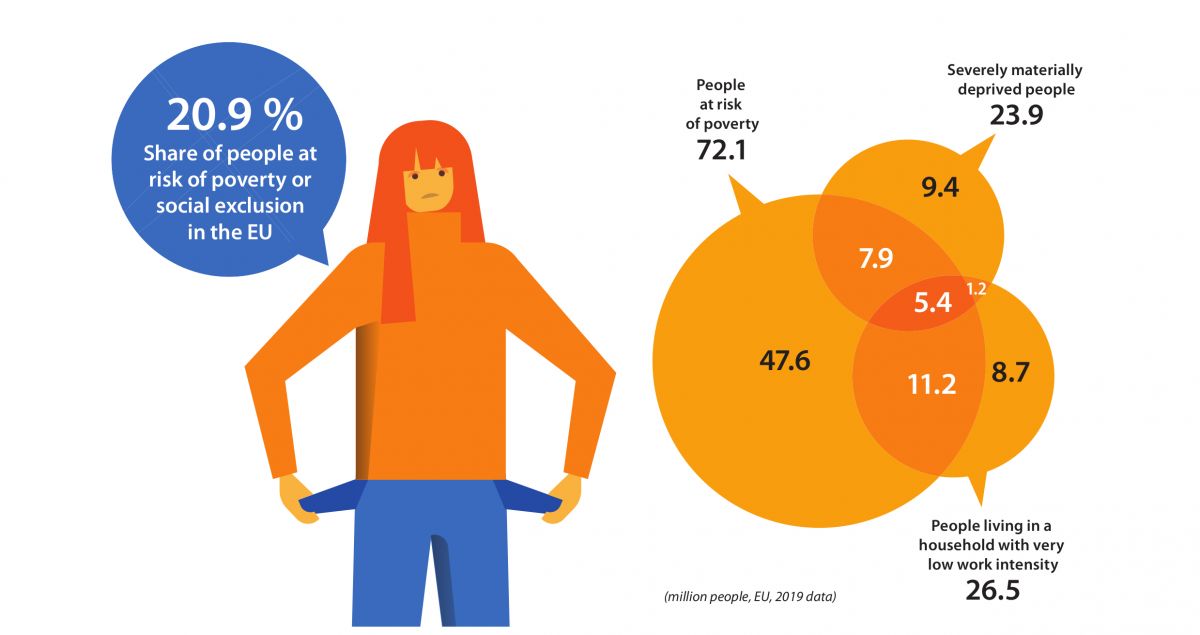
Based on the above definitions, the more common risk of poverty in the EU is relative poverty, on which the indicator for people ‘at risk of poverty or social exclusion’ is based. This indicator is a relatively broad concept: it does not depend exclusively on a household’s level of income, as it may also reflect severe deprivation or quasi-joblessness (as shown in the infographic). The number/share of people at risk of poverty or social exclusion combines three separate criteria covering people who are in at least one of the following situations:
- at risk of poverty — people with a median equivalised disposable income (after social transfers) below the at-risk-of-poverty threshold;
- facing severe material deprivation — people unable to afford at least four out of nine material items that are considered by most to be desirable (or even necessary) for having an adequate quality of life;
- living in a household with very low work intensity — where working-age adults (18-59 years) worked no more than 20 % of their total potential during the previous 12 months.
Social models in the EU are based on offering protection to those who are most in need. Regardless of their differences, these models are designed to provide people with some protection against, among other issues, the costs of bringing up a family, the risks related to unemployment, poor health, the consequences of old age, housing and social exclusion.
Read full article HERE
Source: Eurostat